
When it comes to investing, there are several ways of looking at stocks, commodities, indices and other securities traded on the stock exchange. Long term investors look at fundamental values of any given company (i.e. financial reports) when making decisions on whether to buy its shares. There are also traders who use predominantly technical analysis that deals with market’s sentiment, at any given point, and make their decisions based on specific technical indicators. And then there are some who fall somewhere in the middle – investors who use both kinds of tools to make an informed decision, while picking the right time to enter the market.
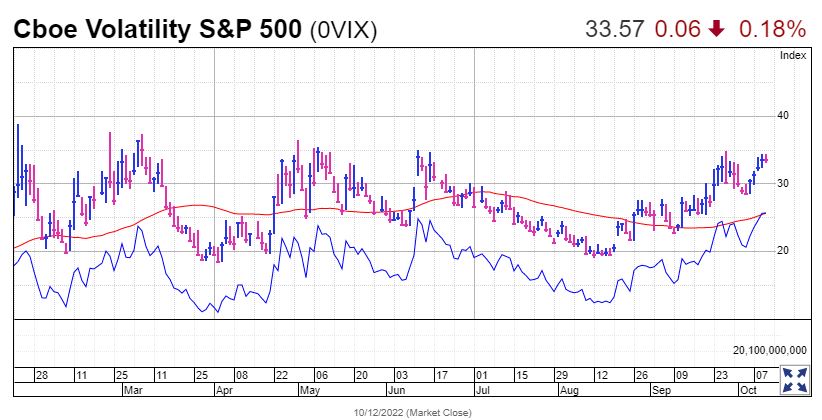
Now, there are certain indices that work predominantly from a technical point of view. One of them is the Chicago Board Options Exchange’s (CBOE) Volatility Index (VIX), which measures the stock market’s anticipation of volatility based on S&P 500 index options. Or, as it is generally called, the Fear Index.
And this index is on the cusp of the ominous technical pattern known as the “golden cross“. This is a term coined to describe a situation when the 50-day moving average of a particular asset (or index) rises above its 200-day moving average.
To give you a perspective, this pattern preceded the market crash of September 2008.
In more recent history, “golden cross” occurred eleven months ago. The three major US stock market indices (Dow Jones, S&P 500 and Nasdaq) reached their cycle peaks just over a month later.
As of Thursday morning, the 50-day moving average for the VIX stood at 25.99, while the 200-day moving average stood at 25.93.
It has to be noted, VIX can indicate that at least a short-term bottom is close when it reaches high levels. The reason being is that when the bears are at their peak, there is no one left to sell.
However, given the depth of the bear market in the US, the VIX may need to reach level of 45 or higher before demonstrating a conclusive proof of a genuine bear market bottom.
Remember, that psychological market indicators like the VIX are just supplementary indicators, they do not provide a call to action. The important indices, like the S&P 500 in the US or TA-35 & TA-125 in Israel, and the blue chip companies that are included in them, hold the key to identifying potential trends in the market. Therefore, investors should always pay close attention to what is fundamentally happening within a given market.


0 Comments